
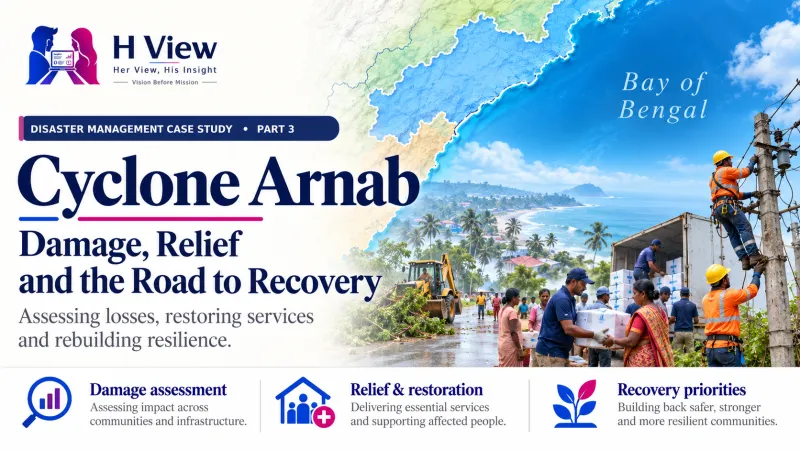
Cyclone Arnab Case Study: Damage, Relief and Recovery (Part 3)
A student-friendly post-landfall case study of Cyclone Arnab: reported crop and power damage, relief announcements, recovery priorities, verified data gaps, charts, tables and FAQs.
What does disaster management look like after landfall? Cyclone Arnab shows that the hardest work can begin after the eye has crossed the coast: confirming who is safe, restoring power and water, reaching isolated villages, recording crop and housing losses, and turning relief announcements into support people actually receive. This third instalment follows that recovery chain and separates verified announcements from estimates that still need checking.
Part 1 examined warnings and preparedness; Part 2 followed the forecast, crossing and early response. Here, the central management question is not simply how large the damage appears. Students should ask whether authorities restored essential services safely, assessed losses fairly, supported livelihoods in time and published evidence that lets the public track progress.
1. The situation after landfall: what is known?
The India Meteorological Department (IMD) reported Arnab over coastal Andhra Pradesh and Yanam during 28 October, with the crossing described in advisories as a process over several hours. News reports used slightly different start and completion times, so this case study treats the crossing window as an operational period rather than claiming one precise minute. By the 29 October 3:55 a.m. bulletin, IMD said the system had weakened to a deep depression and forecast further weakening, while heavy rain and rough conditions remained relevant in parts of the region.
Andhra Pradesh’s immediate priorities therefore changed from moving people away from the approaching storm to checking damage, keeping residents away from unsafe structures and live wires, clearing roads, restoring utilities and starting relief. The state government said response teams and field staff were deployed; the Chief Minister said more than 28,000 people had been shifted to rehabilitation centres. That is a reported operational figure, not by itself proof that every shelter was accessible, adequately supplied or safely closed.
Mind map · The recovery problem has four connected layers
A disruption in one system can slow recovery in the others.
Safety checks, shelter support, health needs and clear local information.
Electricity, drinking water, roads, mobile networks and clinics.
Standing crops, fishers, handloom workers, shops and daily wages.
Verified loss records, fair eligibility, timely payments and public updates.
Systems link: a blocked road can delay a power crew; a power outage can interrupt a water pump or mobile tower; weak connectivity can prevent a family from reporting damage or tracking relief.
2. Damage dashboard: crops, electricity and public services
Crop losses: paddy accounts for most of the reported affected area
A preliminary state estimate reported 2,24,489 hectares of crops affected across 14 districts and around 3.45 lakh farmers. Within that estimate, 2,09,460 hectares were paddy, much of it at a vulnerable mature or harvesting stage; 2,11,726 hectares were reported as agricultural land overall. Waterlogging, lodged plants, grain discoloration and sprouting can reduce both quantity and quality, but the affected-area figure should not be read as hectares of confirmed total crop destruction.
Where were the largest reported crop impacts?
A 29 October report citing the Agriculture Minister identified West Godavari, Konaseema, Kakinada, East Godavari and Krishna among the highest affected areas. The bar chart below compares the preliminary district hectares reported in that update. These five districts account for most of the reported area in that breakdown, but inspection and reconciliation can change the ranking and totals.
Electricity: restoration is a safety operation as well as a repair task
The Andhra Jyothy update shared for this series reported approximately ₹17 crore in electricity-sector damage, around 16,000 damaged poles, outages in 3,872 villages and restoration in 2,549 villages at its report time. A separate Chief Minister briefing cited about 15,000 uprooted poles; APEPDCL’s preliminary network damage estimate was reported as ₹16.54 crore. The difference may reflect reporting time, geographic coverage or whether a figure counts damaged versus uprooted poles. Until a utility-wise reconciliation is released, the figures should remain attributed to their sources rather than merged into one “final” number.
This is a time-stamped report, not a current outage count. Safety checks must precede re-energising damaged lines.
Electricity enables water pumps, mobile towers, clinics, cold storage and small businesses. A performance review should therefore report not only poles repaired, but also how many households regained supply, which critical facilities received backup power, how long restoration took by district and whether crews verified that damaged lines were safe before switching them on.
 Also readCyclone Arnab Case Study: Forecast, Landfall & Response (Part 2)→
3. Relief and recovery finance: announcement is not delivery
On 29 October, the Chief Minister announced ₹5 lakh ex gratia for each of five families recognised in that briefing. He also announced ₹1,000 for people staying in relief camps, 25 kg of rice for families whose homes were inundated, and 50 kg of rice plus essential food items for handloom workers and fishers. These are reported announcements. This case study does not claim every eligible household had already received the support; that requires a government order, eligibility details and delivery records.
Crop support was still being assessed. The Chief Minister described proposed assistance of ₹35,000 per hectare for banana and ₹25,000 per hectare for tomato, while ₹25,000 per hectare for cotton, sugarcane and certain other crops was under consideration. Officials said field-level enumeration would establish losses. Students should treat these rates as proposals reported at the cutoff, not as a final compensation schedule or a promise that every farmer will receive the same amount.
Follow the money · four numbers that must not be confused
What assets or livelihoods may have been lost? Example: the early ₹17 crore power-network estimate.
What does each district need for relief, repair and rehabilitation?
What amount has government formally approved, and from which fund?
What was actually spent or received, by whom, and when?
Budget finding at the cutoff: sources reviewed did not provide one consolidated final cyclone-loss total or complete recovery budget. The state had sought central assessment and assistance, and preliminary damage estimates were still being prepared. The ₹17 crore electricity estimate is one sector’s early damage figure—not the cost of the whole disaster, a relief package or the total public allocation.
| Measure | Reported by 29 Oct | What must be checked next |
|---|---|---|
| Power | About ₹17 crore estimate; 15,000–16,000 poles in differently attributed reports | Final utility-wise repair cost, outages, safety audit and restoration time |
| Agriculture | 2,24,489 ha preliminarily affected; about 3.45 lakh farmers | Crop and plot verification, severity, insurance, claims and payments |
| Fatalities | Government announced aid for five families; media totals differed | One reconciled official list with cause, district and confirmation status |
| Recovery budget | No complete consolidated figure in the sources reviewed | Approved allocation, central support, actual spending and beneficiary payments |
4. Did the response work? Use an evidence scorecard
Officials said advance planning and continuous monitoring helped reduce losses. That is an important claim, but a case study should test it against outcomes and acknowledge that no single number proves success or failure. A fair review compares the hazard forecast with what happened, then checks whether warnings reached exposed households, whether evacuation was safe, whether essential services returned and whether relief reached eligible people.
Response chain · from warning to recovery
Forecasts, district alerts and understandable instructions.
Evacuation, transport, accessible shelters and health support.
Safe roads, electricity, water, communications and clinics.
Verified losses, fair payments, livelihood support and stronger rebuilding.
A failure at one hand-off can undo work elsewhere: a warning may be accurate but ineffective if transport is unavailable, and a compensation policy may be generous on paper but inaccessible in practice.
| Review question | Useful evidence | Why it matters |
|---|---|---|
| Were people safe? | Verified deaths and injuries, rescue logs, shelter occupancy and unmet needs | Measures human outcomes, not just teams deployed |
| Did essential services return? | District outage duration, safe reconnection, water and telecom status | Shows whether daily life and other services could resume |
| Was relief fair? | Eligibility, applications, approvals, rejections, appeal times and actual payments | Reveals who was missed and whether support arrived in time |
| Can the public audit progress? | Dated dashboard, source, definition, department owner and next update | Prevents changing snapshots from being mistaken for final totals |
5. What should happen in the recovery phase?
Recovery should begin with safety and then move to transparent restoration. Authorities need to inspect homes, schools, clinics, roads, bridges, power lines and water systems; keep unsafe areas clearly marked; and provide local routes for residents to report missing services. At the same time, district teams should publish a dated dashboard with electricity and water restoration, road access, shelter status, verified casualties, crop assessments and relief distribution, with a named department and timestamp beside every figure.
For farmers and workers, speed matters because a delayed assessment can push a household into debt or cause it to miss the next planting or fishing window. Joint field teams can reduce repeated paperwork, while local help desks and appeal channels can help tenants, smallholders, women-led households, older residents and people with disabilities who may not be able to use online forms. Government should publish both approval and payment status so that a sanctioned benefit is not mistaken for money already received.
Finally, an after-action review should compare what was forecast with observed weather and district-level impacts, then trace how warnings, transport, shelters, rescue, power repair and assistance performed. Each recommendation needs an owner, a deadline and a public progress check. Replacing damaged assets to the same vulnerability level may restore service today but preserve the same losses for the next storm; rebuilding should use the damage map to identify safer locations, stronger components and better backup capacity.
Her View · Make recovery reachable
A relief process is only real when a household can understand it, apply without repeated trips and learn what happens next. Recovery teams should listen to people who are often missed by standard forms—informal workers, tenants, women managing households, older people and residents with disabilities—and make corrections possible without stigma.
His Insight · Restore connected systems
A power pole supports more than a light: it can keep pumps, towers, clinics and businesses working. Managers should map these dependencies and prioritise repairs that restore several essential services together, while tracking safety and outage duration—not just the number of assets replaced.
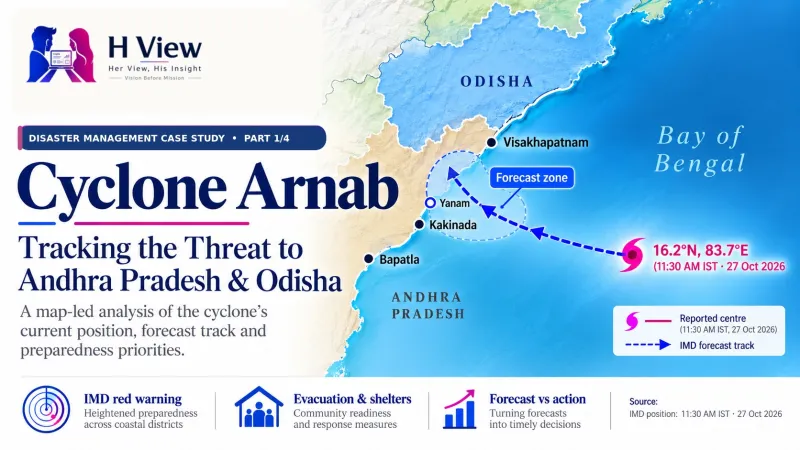 Also readCyclone Arnab Case Study: Before Landfall (Part 1)→
FAQs
Where and when did Cyclone Arnab cross the Andhra Pradesh coast?
IMD advisories described the coastal crossing during the early hours of 28 October 2026, in the Andhra Pradesh–Yanam coastal sector. Reports used different start and end times for the crossing process, so students should cite the bulletin and its issue time when quoting a precise window. The storm then moved inland and weakened; landfall did not mean the rain and safety risks ended immediately.
How much crop damage had been reported?
Preliminary reports on 29 October put the affected area at 2,24,489 hectares across 14 districts and the number of farmers at about 3.45 lakh. Paddy accounted for 2,09,460 hectares in the reported breakdown. These are early affected-area estimates, not the final value of crop loss or a confirmed count of totally destroyed hectares.
Was ₹17 crore the total loss caused by the cyclone?
No. It was an early estimate for electricity-sector damage reported by Andhra Jyothy. The full disaster cost would also need verified estimates for crops, houses, roads, public buildings, fisheries, businesses, health effects, service interruption and recovery spending, with overlapping losses removed.
How many people died in Cyclone Arnab?
Fatality totals were not consistent across early reports. The Chief Minister’s 29 October briefing announced assistance for five families, while media reports cited higher numbers as districts verified incidents. Those are not necessarily equivalent measures; this article leaves the final toll open until an official reconciled list is published.
What relief did the Andhra Pradesh government announce?
The reported announcements included ₹5 lakh ex gratia for each of five families, ₹1,000 for people in relief camps, rice for inundated households, and food support for handloom workers and fishers. Crop assistance rates were being proposed or considered while field assessments continued. The announcement and the delivery of a benefit are separate steps, so payment status should be verified before describing it as received.
Has the final Cyclone Arnab recovery budget been announced?
The sources reviewed by the 29 October evidence cutoff did not provide a consolidated final loss total or complete recovery budget. The state was preparing preliminary estimates and had sought central assessment and financial assistance. A final answer needs formal allocations and actual expenditure, not only damage estimates or relief rates.
What should students use to decide whether disaster management worked?
Compare dated forecasts and warnings with observed conditions, then examine who was reached, evacuated and sheltered; how quickly power, water, roads and communications returned; what losses were verified; and whether eligible people received support. A balanced conclusion should name both results and evidence gaps instead of judging the response from one headline or one early number.
Conclusion: measure recovery by outcomes people can verify
Cyclone Arnab’s case is now moving from emergency response into recovery, but “the storm has crossed” is not the same as “the disaster is over.” Early reports point to extensive crop impacts, damaged electricity infrastructure and continuing restoration needs; they also show why a student must keep estimates, proposals, allocations and payments distinct. The strongest management test is whether people become safe, essential services return reliably, livelihoods recover and public evidence is clear enough to hold institutions accountable.
Sources and evidence notes
- India Meteorological Department, Coastal Bulletin, issued 29 October 2026 at 3:55 a.m. IST — inland movement, weakening forecast, rainfall and coastal conditions at that bulletin time.
- Andhra Jyothy, 29 October 2026 — early electricity damage estimate, damaged poles, village outages and restoration snapshot; Telugu-language report.
- The New Indian Express, Chief Minister briefing, 29 October 2026 — relief announcements, proposed crop rates, pole estimate, restoration and rainfall statements.
- The New Indian Express, crop impact report, updated 29 October 2026 — preliminary crop area and farmer totals.
- The Pioneer, 29 October 2026 — crop-area breakdown and district-wise preliminary figures.
- The New Indian Express, 29 October 2026 — reported casualty-count difference and ongoing impacts.
- Andhra Pradesh State Disaster Management Authority, Cyclone Information Management System — public operational dashboard; live figures can change and should be checked with their timestamp.
Editorial update note: This article records reports available on 29 October 2026 and is not a final impact audit. Update each time-sensitive figure only when a dated government release, IMD bulletin or later verified report supersedes it; preserve the source, definition and update time.
H View stories follow our editorial policy. Spotted an error? Tell us and we will correct it.
Rate this article
One tap is enough. No comment needed.
Was this article helpful?
Your answer goes straight to our editors.










Comments0
No comments yet. Start the conversation.